

WHITE PAPER: Examining the portfolio differences between public and private equity and avoiding correlation neglect by Mark Hedges, Chief Investment Officer, Nationwide Pension Fund.
Equity investment by pension funds has seen two ongoing themes shaping their exposure to equity over recent years. These are a continuing shift away from active management of their public equity exposure to highly liquid passive index based exposures, with the more sophisticated pensions looking to diversify their passive equity exposure through smart beta and risk factor investing.
In tandem with this shift has been increased exposure to illiquid private equity as an alternative source of return to public equity. Private equity has a range of different investment styles and sub classes of investment but fundamentally it is a very active approach to investment. The classic private equity firm invests in a company that is ready to transition, it is an entrepreneur or family owned business that needs to grow; not just its revenues but is operational and organisational structure. It is not just about additional capital, it is also about having the right human resources to implement a planned growth strategy.
Private equity is active management at its most direct. Private equity managers will seek to drive the business, taking an active role in board positions and frequently having staff operating in executive positions pending recruitment of the “right” individuals to implement their strategy. Typically, both the private equity firm and management will contribute to the strategy and direction of the business.
So, it appears investors have a belief in active management in illiquid private markets but not in public markets. The shift from active to passive management in public equities has frequently been seen as fee driven. Passive fees come in single basis points whilst long/short equity managers still charge 100bps or more, and yet active equity has not (in the view of many) compensated for this higher fee charge. Conversely, high fee charges in private equity have not put off the growth of private equity investment, despite highly public concerns being expressed about fees paid to private equity by some U.S. public pension funds. Of course, larger funds can drive this cost down through cornerstone positions and taking up co-investment opportunities, but this is not an option available to many pension funds.
Fee costs are not the sole reason from the switch from active to passive; pension fund trustees often consider public equities as very transparent (all investors have access to the same information), so the scope for selecting undervalued stocks appears very limited.
Active management in public markets is driven by a variety of strategies, but ultimately managers seek to add value from acquiring stocks that are undervalued and selling stocks when they are overvalued. They will dress this up in different ways; for example, a macro driven manager may buy stocks in sectors they consider there are strong headwinds for growth that are not priced in by the market generally. Some fund managers turnover their holdings frequently and they typically run larger portfolios of 80-100 stocks while others may take a longer-term approach holding small very unconstrained portfolios of 20 to 30 stocks where they have larger positions. These funds will seek close relations with management, but typically they are not able to directly influence the business in a way that a private equity business can with its direct ownership.
Of course, there a few activist funds. Trian is one that actively seeks to change the strategy of the companies in which it invests. These funds take an aggressive approach, acquiring large holdings in companies where they believe they can set out a strategy to management that will improve shareholder value. Often they may gain a seat on the board to help oversee such a strategy. These funds are however only a small part of the public equity fund management sector.
There is an argument that the purpose of management is to deliver shareholder value by setting out a business plan to develop the public entity they manage, and this is no different to private equity directing and establishing a management team to implement a business plan. Some management teams of publicly listed entities will do this well, and some not so well. Similarly, not all private equity businesses succeed. Private equity funds will often have one or two write-offs in a fund relying on the performance of the rest of the portfolio to generate sufficient returns to offset this loss of capital and still reach its target return.
When we consider returns from the underlying investments public and private equity are clearly linked. Public equities have a market price that reflects the price/earnings ratio of the business. The market is essentially taking a view on how the earnings will grow over time. When a private equity firm looks to evaluate its underlying investments, it will generally look at multiples of earnings. Moreover, in considering its business plans, it looks at entry multiples relative to exit multiples on the planned growth. In a sense buying cheap and hopefully selling when prices are higher. This is not a fundamentally different view than that taken by many active equity managers. In both public and private equity, managers will also often look to comparable pricing for similar companies as a means of gauging value.
This is clearly not comparable, however, to classic passive indexing. Investing in your typical market capitalisation index sees the investment portfolio rebalancing into stocks that have increased in value, and out of stocks that have fallen in value, to maintain the proportions in the index. This intuitively seems contrary to the mantra of “buy cheap and sell when expensive.” Whilst this is not counter to all active equity mangers; momentum traders, for example, will typically invest in stocks that have high returns over the previous period, and sell those that have had poor returns over the same period. It is a very different approach to private equity investment.
Whilst evaluation of underlying assets may be similar evaluation of fund performance is very different. This is the function of the long term illiquid nature of private equity, and the relatively liquid nature of public equity funds. Private equity is normally evaluated in terms of internal rates of return (IRR) and multiples of paid in capital, with the focus of these being total value to paid in capital (TVPI) and cumulative distributions to paid in capital (DPI). These multiples are not a feature of public equity management, which looks for returns relative to an index with further analysis focussed frequently on Sharpe and Information ratios as comparative measures of performance of funds.
Do these differences generate any different returns? Some analysis undertaken by the American Investment Council suggests performance in the U.S. private equity sector is mixed.
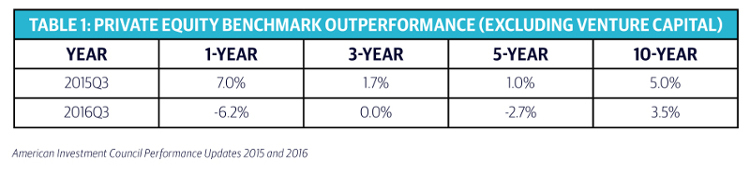
This could all be about timing, but then arguably much of investment is. Perhaps the key figure is the long-term return over 10 years (there appears to be on-going outperformance versus the S&P 500 Index). PE firms typically have a life of 10 years – funding is locked up for the period and pension funds are natural holders of longer term investments.
Certainly, demand for private equity continues to grow. The market, if anything, exhibits concerning issues as we see larger funds, higher purchase multiples, higher leverage, increasing amounts of dry powder and increasing signs of corporate defaults. Naturally, these conditions are creating investor fears – that we are reaching a new market peak for buyouts, and that a market correction may be on the horizon – although predicting actual triggers for such an event (economic or political) is very difficult.
The following section looks at some the drivers for concern.
Global Deal Making
Much of private equity is part of the larger mergers and acquisitions market, and trends in that market impact private equity (as does dry powder in private equity funds). Global private equity deal volumes fell sharply in 2016. Overall mergers and acquisitions (M&A) activity also fell from its 2015 high that was driven by a few very large public-sector transactions. The steepest drop, however, was in the first part of the year amid volatile public market prices, and activity increased strongly in the second half of the year. Private equity as a percentage of total M&A fell in 2016 to 12.5% of the market from 14.9% in 2015, as private equity buyers became more conservative.
Equity Dry Powder
Dry powder continued its four-year trend of steeply increasing globally, hitting a new record in 2016. This high level of dry powder is putting pressure on purchase prices and increasing competition among fund managers when buying or investing in companies.
Chart 1 Private Equity Dry Powder by Investment Strategy:
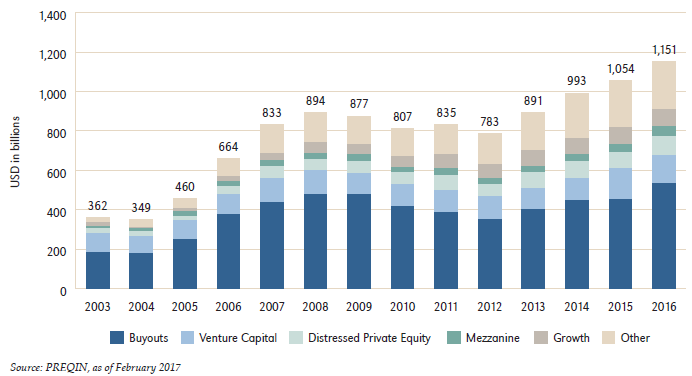
It should be noted that buyout funds make up 46% of the overall dry powder total; they remain the largest sector of the global private equity market. On a geographic basis, North America (which includes several U.S.-based mega-buyout funds that invest globally) has the largest capital overhang with 58% of global dry powder (Europe has 24%). Dry powder for emerging market funds was the only sector that declined in 2016. The dry powder numbers do not include allocations to co-investment because they are not easily tracked, so these numbers are certainly understated.
Purchase Price Multiples
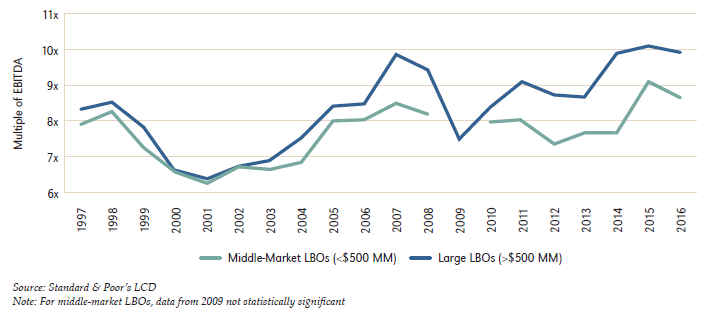
Buyout funds are the largest segment of the market, and factors impacting these types of funds will impact the performance of most institutional private equity portfolios. Purchase price multiples for large buyouts in the U.S. fell slightly last year, but remained above the pre-2007 financial crisis market peak. Middle-market multiples declined more sharply, but again they were still higher than the 2007 level. These high purchase multiples offer an excellent opportunity to exit current investments for significant returns, but make it more difficult to buy companies at attractive prices. Now looks a good time to be invested in funds that are realising assets but less so in newly deploying funds.
Chart 2: Average U.S. LBO Purchase/Adjusted EBITDA Multiples:
Debt issuance and defaults
High yield debt issuance has often been associated with private equity as sponsors actively source leverage as an additional source of capital rising. In high yield markets default rates often coincide with rising levels of issuance, as highlighted in Chart 3 below.
Chart 3 U.S. High Yield Issuance and Default Rates:
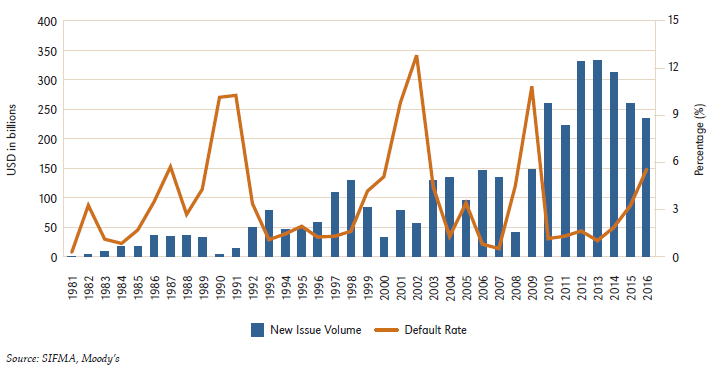
There has been a significant amount of new issuance since 2010, with new record levels. A lot of this new issuance has been geared to refinancing old debt at lower interest rates, but even so there has been a larger amount of additional debt raising. It is notable that default rates began to rise noticeably in 2015, and in 2016 they rose above the long-term average of 3.5%, driven by trouble in both the oil & gas and retail sectors. Though not obvious in the chart, some of that default pressure abated late in 2016, as oil prices began to rise.
These features of the market are ones that investors will watch with interest, as they all suggest that private equity markets are in danger of becoming overheated. But public equities are also in the same space with record highs being set this year. If the winding down of QE and rising rates are not managed carefully public equities may suffer a sharp correction, and this will have a knock-on effect to private equity pricing. Private equity does however have the luxury of waiting for an improvement in markets before assets are sold, and volatility in the values may prove to be lower than that of public markets, which often over-react and clawback some of the fall fairly quickly.
This white paper is from the Investing in Private Markets, Europe 2017 report. Download your free copy of the full report online now.